How many hours—no, days—of your life have you lost to the thankless task of building charts? You know the drill. You get the data, clean it up, and then the real “fun” begins. Should this be a bar chart? A line chart? A scatter plot that your boss will pretend to understand? Then comes the color palette. You spend an eternity tweaking hex codes, trying to make something that doesn't look like a 90s GeoCities page, all while your project deadline looms.
It’s a pain. A real, genuine pain. We got into this field to find insights and tell stories with data, not to become second-rate graphic designers.
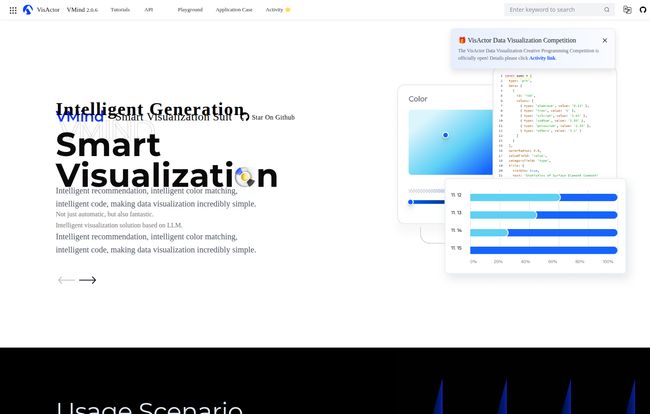
So, when a tool comes along promising to automate all that grunt work with AI, my ears perk up. But my skepticism meter also goes into overdrive. I’ve seen a lot of “intelligent” tools that are anything but. Today, we’re looking at one that might just be different: VMind, a component from the VisActor suite. The promise? Smart visualization that’s not just automatic, but also fantastic. Let's see if it holds up.
So, What on Earth is VMind?
In simple terms, VMind is like an AI-powered sous-chef for data visualization. It’s not the whole kitchen, but it's the expert assistant that preps everything, suggests pairings, and basically makes the head chef (that's you) look like a genius. It's one part of a larger family of tools called VisActor, which is a full-blown solution for data visualization that includes libraries for charts (VChart), tables (VTable), and even narrative storytelling (VStory).
And here’s the kicker that made me sit up and pay attention: VisActor is the engine behind the visualizations at some massive companies. We’re talking about TikTok, Douyin, and Toutiao. These aren't small blogs; they're platforms serving billions of users. If the underlying tech is good enough for them, it's certainly worth a closer look for the rest of us. VMind aims to take that powerful engine and make it ridiculously simple to use by layering AI on top.
The AI Magic Behind the Curtain
VMind isn't just one thing; it's a collection of intelligent features designed to tackle the most annoying parts of chart creation. It does this using a mix of rule-based algorithms, machine learning, and yes, the ever-present Large Language Models (LLMs).
Your Personal Chart Recommender
This is probably my favorite feature in concept. You give VMind your raw data, and it analyzes it to suggest the most effective type of chart. It looks at your data fields, types, and the relationships between them to make a recommendation. This alone could save hours of debate in team meetings. It’s like having a seasoned data scientist whisper in your ear, “Psst, that should definitely be a stacked bar chart.” It’s designed to cut through the noise and get you to a logical starting point, fast.
Visit VMind
Color Matching That Doesn’t Suck
I have a confession. I'm terrible at picking colors. My charts either end up looking bland and corporate or like a unicorn threw up on the screen. VMind’s intelligent color matching is a godsend for the artistically challenged among us. It generates aesthetically pleasing and contextually appropriate color palettes automatically. This means better-looking charts, better accessibility, and one less thing for me to worry about. It’s like having an on-call graphic designer who never sends you a bill.
From Plain English to Polished Chart
This is where the LLM integration really shines. VMind allows for intelligent code generation. You can describe the chart you want in natural language—something like, “Show me the monthly sales trend for the last year”—and it will generate not just the visual chart but also the underlying code to implement it using VChart. This is a potential game-changer. For developers, it’s a massive productivity boost. For data analysts or product managers who are less code-savvy, it offers a way to create high-quality, spec-compliant visualizations without writing a single line of code themselves. It's a bridge between ideas and implementation.
The VisActor Connection: An Ecosystem or an Island?
One of the first things I noticed is that VMind is deeply integrated with the VisActor suite. This is both its greatest strength and a potential hurdle. If you're already using or planning to use VChart or VTable, then VMind slots in perfectly. The components are designed to work together, creating a powerful, cohesive environment. Everything just fits.
But what if you're not? Some might argue this creates a walled garden. To get the most out of VMind, you probably need to buy into the whole VisActor philosophy. In my experience, this is a common trade-off. Standalone tools offer flexibility, but integrated ecosystems offer power and convenience. I tend to lean towards ecosystems if they are robust enough, and given VisActor’s pedigree, it seems like a pretty solid bet. It’s not so much a walled garden as it is a well-planned city. Sure, you have to learn the street layout, but once you do, getting around is incredibly efficient.
The Automation Dilemma: Speed vs Control
Here’s the million-dollar question with any smart tool: how much control do you give up for that convenience? VMind is designed to automate, which means it makes a lot of decisions for you. For 80% of use cases, this is fantastic. You get a great-looking, effective chart with minimal effort. But what about that other 20%? The times when you need to tweak every single pixel, override a color choice, or create a completely bespoke, never-before-seen visualization for a specific story.
This is where tools like VMind might show their limits. The auto-generated code gives you a starting point for customization, which is great, but the very nature of its “intelligence” means it’s optimized for common, effective patterns. If your goal is to create something truly on the bleeding edge of data art, you might still find yourself firing up a library like D3.js and building from scratch. But for business dashboards, internal reports, and rapid prototyping? VMind seems poised to be an incredible accelerator.
What's the Damage to My Wallet?
Ah, pricing. The one thing everyon wants to know. As of right now, there's no clear pricing page for VMind. This usually means one of a few things: it might be fully open-source (VisActor has a strong open-source presence on GitHub), part of a larger enterprise package from its parent company (ByteDance), or they’re still figuring it out. My gut tells me it's likely open-source for individual developers, with potential enterprise support plans. Your best bet is to check out their GitHub repository for the latest details on licensing and usage.
My Final Take on VMind
After looking through what VMind offers, I'm genuinely optimistic. This doesn't feel like more AI snake oil. It feels like a thoughtfully designed tool built to solve a real, nagging problem for anyone who works with data. It’s not trying to replace the developer or the analyst; it’s trying to be their most valuable assistant.
The true power here is the reduction of what the creators call “mental burden.” It's a perfect description. VMind clears out the tedious, repetitive tasks, freeing up your brainpower to focus on what actually matters: the story the data is telling. It won’t be the right tool for every single project, especially those requiring obsessive, fine-grained control. But for the vast majority of day-to-day data visualization work, VMind looks like it could turn a multi-hour headache into a five-minute task. And that’s a proposition that has me very excited indeed.
Frequently Asked Questions about VMind
1. What is VMind in a nutshell?
VMind is an intelligent component within the VisActor suite that uses AI to automate data visualization. It can recommend chart types, generate color palettes, and even create charts and the necessary code from plain English prompts.
2. Do I need to be a developer to use VMind?
Not necessarily. Thanks to its natural language processing features, non-developers like analysts or managers can generate charts just by describing what they need. However, developers will find it most powerful, as it generates VChart code that they can then integrate and customize further.
3. Is VMind free to use?
Pricing information isn't explicitly stated, but the VisActor project has a strong open-source presence. It's likely free for individual and open-source use under a license like MIT or Apache. For commercial or enterprise use, you should consult their GitHub repository or contact them directly.
4. How does VMind compare to tools like Tableau or Power BI?
It's a bit of an apples-to-oranges comparison. Tableau and Power BI are end-to-end business intelligence platforms for building and sharing interactive dashboards. VMind is a developer-focused component. It's meant to be integrated into applications and workflows, rather than being a standalone analysis tool. It competes more with visualization libraries like Chart.js or Highcharts, but with a powerful AI layer on top.
5. What technologies does VMind use?
VMind is built on a combination of technologies, including rule-based algorithms for basic logic, machine learning for more complex pattern recognition (like chart recommendations), and Large Language Models (LLMs) for understanding natural language prompts and generating code.
6. Can I customize the charts VMind generates?
Yes. A key feature is its intelligent code generation. It produces the actual code for the chart (using VChart), which a developer can then modify and tweak to meet specific requirements. So you get the speed of automation with an open door for manual customization.
Reference and Sources
- Official VMind Page on the VisActor Website
- The VisActor Project on GitHub for source code and licensing
- D3.js - Data-Driven Documents, a popular library for manual, highly-customized visualizations