I’ve spent more hours than I care to admit staring at spreadsheets until my eyes blurred. I’m talking about those late nights fueled by lukewarm coffee, trying to wrangle data from ten different sources, praying my VLOOKUP formula doesn’t break. For years, deep financial analysis has been a kingdom guarded by clunky software, arcane commands, and a price tag that could make a grown CFO weep. We just accepted it as the cost of doing business.
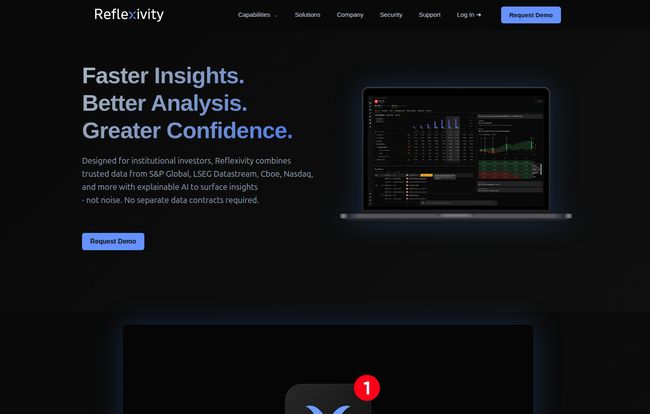
But what if you could just… ask? What if you could talk to the data like you’d ask a colleague for a report? That’s the promise of a tool that’s been making some quiet waves in serious financial circles: Reflexivity.
And when I say “serious circles,” I’m not kidding. Their website mentions they’re featured by the likes of Muddy Waters and Hindenburg Research. Yeah, those guys. The ones famous for forensic, deep-dive research that moves markets. When a tool gets a nod from them, I sit up and pay attention. This isn't your average stock screener app.
Visit Reflexivity
So, What Exactly Is Reflexivity, Anyway?
Let’s cut through the jargon. At its heart, Reflexivity is an analytics platform that combines institutional-grade financial data with a powerful AI, all wrapped up in a natural language interface. Think of it like this: you get the brain of a quantitative analyst and the data library of a top-tier investment bank, but you get to interact with it through a simple chat window.
Instead of learning a complex query language or navigating a maze of menus, you can literally type, “Compare the cash flow of Apple and Microsoft over the last five years and plot it on a chart.” And it just… does it. It's a personal laboratory for your financial hypotheses, designed to close the gap between a brilliant idea and the data-backed evidence needed to prove it.
The Core Features That Actually Matter
A feature list is just a list until you see how it works in the real world. Let’s break down what Reflexivity brings to the table for an analyst or investor.
Just Ask Your Question: The Magic of Natural Language
This is the main event. The entire platform is built around its LLM-powered interface. For anyone who's fought with SQL or proprietary terminal commands, this is a breath of fresh air. The ability to perform complex filtering and data discovery using plain English removes a massive technical barrier. It democratizes the process of analysis, letting you focus on the questions you want to ask, not the mechanics of how to ask them.
Your Personal What-If Machine for Scenarios
One of the most powerful aspects is scenario testing. You can quickly model outcomes based on different assumptions. “What would happen to this company’s valuation if interest rates rise by 50 basis points and their input costs increase by 10%?” In the old days, that was a whole new spreadsheet model. Here, it’s a conversation. Combined with its chart exploration tools, you can visualize these scenarios instantly, making it easier to spot trends and outliers that a wall of numbers might hide.
Uncovering Hidden Connections with the Knowledge Graph
This one is particularly fascinating to me. A knowledge graph isn’t just about a single company’s financials. It’s about mapping the entire ecosystem. It connects companies, their executives, supply chain partners, investors, and news events. It's how you uncover the non-obvious relationships that can represent either opportunity or un-seen risk. It's the kind of web-like thinking that short-sellers like Hindenburg are famous for. This tool basically digitizes that investigative process, helping you find the signal in the noise. Who sits on whose board? Which companies share the same key supplier? That’s the good stuff.
Who Is This Really For?
Let's be clear. Despite the user-friendly interface, this probably isn't a tool for someone just starting to invest their first $1,000 with a Robinhood account. The constant mention of “institutional-grade” is a big clue. The target audience is the professional sphere: hedge fund analysts, private equity associates, investment bankers, family offices, and serious independent researchers.
"It’s built for people whose decisions are measured in millions, not hundreds, and who need data integrity that’s beyond reproach."
If your job involves rigorous due diligence and building a defensible investment thesis, Reflexivity is speaking your language. If you're just looking for a hot stock tip, this is probably overkill.
The Good, The Bad, and The Pricey
No tool is perfect, right? Every platform has its trade-offs. Here’s my honest breakdown of what I see with Reflexivity.
The advantages are obvious and compelling. The accessibility of the natural language query is a massive win, saving incredible amounts of time and frustration. The quality of the underlying data and the sheer analytical power of the AI and knowledge graph are top-notch. It’s a tool designed for generating true alpha, not just re-packaging public information.
Now for the reality check. The biggest question mark is pricing. The website has a “Request Access” button, which is industry code for “If you have to ask, you might not be able to afford it.” This is an enterprise solution, and it will almost certainly come with an enterprise price tag. Also, while the interface is simple, the concepts of financial analysis are not. A beginner might be able to ask a question, but they might not understand the nuances of the answer. Finally, any data platform is only as good as its data. While Reflexivity boasts institutional-grade sources, the user still needs to trust that the underlying information is accurate and complete—the classic 'garbage in, garbage out' problem that affects all analytics.
| Potential Strengths | Potential Drawbacks |
|---|---|
| Intuitive natural language interface. | Pricing is not public; likely expensive. |
| Access to institutional-quality data & analytics. | May have a conceptual learning curve for complex finance. |
| Powerful AI-driven insights and scenario testing. | Effectiveness depends on the accuracy of source data. |
| Unique knowledge graph for deep diligence. | Geared towards professionals, not casual investors. |
My Personal Take on Reflexivity
So, is it a game-changer? For the right kind of user, I honestly think it could be. For too long, the financial analytics space has been dominated by a few legacy players with outdated user experiences. We've been forced to adapt to the machine's language.
Reflexivity flips that script. It makes the machine adapt to our language. It feels less like operating a complex piece of machinery and more like having a conversation with a ridiculously smart research assistant. It's a step toward what I believe is the future of the industry, where insight generation is less about your ability to code and more about your ability to ask the right questions.
It won't replace human intuition or the critical thinking of a skilled analyst. No AI can do that. But what it can do is clear away the tedious underbrush of data collection and manipulation, freeing up that analyst’s most valuable resource: their time and brainpower to think about the bigger picture.
Frequently Asked Questions About Reflexivity
1. What is Reflexivity in simple terms?
Reflexivity is an advanced financial analytics platform that lets you ask complex questions about companies and assets using everyday language, giving you access to high-quality data and AI-powered insights without needing to be a data scientist.
2. How is Reflexivity different from a Bloomberg Terminal?
While both provide access to deep financial data, the primary difference is the user interface. Bloomberg and similar terminals often rely on specific codes and a complex menu system, whereas Reflexivity is built around a conversational, natural language query system, making it much more intuitive to use.
3. Is Reflexivity suitable for beginner investors?
While its interface is easy to use, the depth of the data and the nature of the tool are geared towards financial professionals, institutional investors, and serious researchers. It's likely overkill for a casual or beginner investor.
4. How much does Reflexivity cost?
Reflexivity does not list its pricing publicly. You need to contact their team and “Request Access.” This typically indicates a subscription-based enterprise pricing model tailored to the specific needs of a firm or individual professional.
5. What kind of data does Reflexivity use?
It uses institutional-grade data, which typically includes everything from financial statements, SEC filings, and market data to alternative data sources that help build its knowledge graph of relationships between assets and organizations.
6. Can I integrate Reflexivity with my existing tools?
The platform information suggests that customizable AI solutions and integrations are available, meaning it's likely designed to fit into a professional's existing workflow, but you would need to discuss specifics with their sales or support team.
The Final Word
The world of investment research is dense and competitive. Any edge, any tool that can speed up the discovery process without sacrificing diligence, is worth its weight in gold. Reflexivity appears to be one of those tools. It's a powerful fusion of AI and human curiosity, a platform that understands that the best insights often start with a simple question. While it's aimed at the high end of the market, its core philosophy—making data conversational—is a trend I hope we see more of across the entire industry. It's a genuinely exciting development.
Reference and Sources
- Reflexivity Official Website
- Hindenburg Research (for context on short-selling research)
- Muddy Waters Research (for context on activist investment)