I have a confession to make. I’ve been in the SEO and digital marketing game for years, and while I love digging through data, my relationship with R can be… complicated. There are days I feel like a coding genius, and other days I spend three hours trying to figure out why a simple ggplot just won't render. You know the feeling. It's that moment of pure frustration where you consider throwing your laptop out the window and becoming a goat farmer.
So, when I hear about tools that promise to bridge the gap between human questions and machine code, my ears perk up. It's a mix of excitement and deep, deep skepticism. The latest one to cross my desk is called RTutor, an AI-powered app that claims to translate your plain English (or other languages!) into executable R code. No coding? Just ask a question and get a result? Yeah, right. I had to see this for myself.
So, What Exactly is RTutor?
Think of RTutor as a translator. But instead of translating Spanish to English, it translates your data query—like "show me the correlation between traffic source and conversion rate"—into the specific, often finicky language of R. It's built on the back of OpenAI's models (the info I found mentions both Davinci and the newer, zippier GPT-4o) and runs within a Shiny platform, which is basically a way to create interactive web apps with R.
The whole pitch is seductively simple: you upload your dataset, you type your question, and it spits out not just the answer, but the actual R code that got you there, along with visualizations and reports. For anyone who’s ever stared at a blank R script with a blinking cursor mocking them, this sounds like a dream.
Visit RTutor
My First Impressions of the User Experience
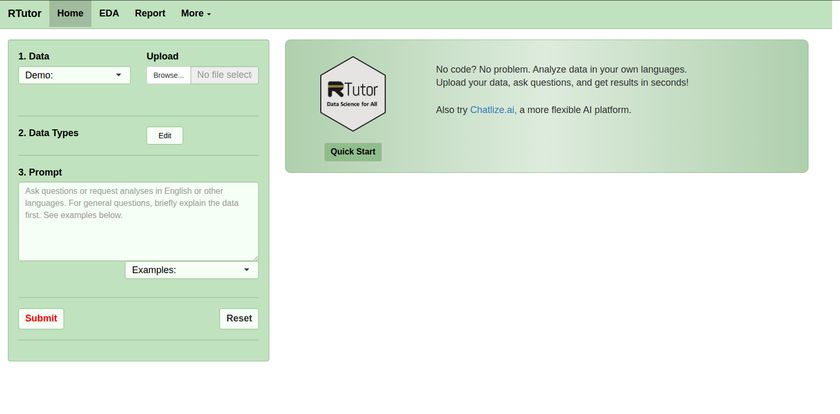
Hopping into the app, the interface is… spartan. And I don’t mean that in a bad way. It’s clean, no-nonsense, and gets straight to the point. There aren't a million buttons or confusing menus. It's a simple, three-step process laid out on the left side of the screen.
Upload, Ask, and Away You Go
First, you upload your data. It seems to prefer tidy, traditional data formats, so your beautifully chaotic spreadsheet might need a little cleanup first. Think CSVs, not a collection of screenshots and hope. Once uploaded, you can check and edit the data types, which is a nice touch for making sure it's interpreting your numbers as numbers and your categories as categories.
Then comes the magic box: the 'Prompt' field. This is where you have your conversation with the machine. I started with something simple from a demo dataset: "Create a bar chart of the different classes." I hit submit, held my breath, and in a few seconds… it worked. A neat little bar chart appeared, along with the chunk of R code that generated it. No fuss. It felt a bit like magic, I wont lie.
The Good Stuff: Where RTutor Really Shines
After playing around for a while, a few things really stood out. The biggest win is, without a doubt, the automation of Exploratory Data Analysis (EDA). EDA is the first, crucial step in any data project. It's the part where you get a feel for your data, look for patterns, spot outliers, and form hypotheses. It can also be incredibly tedious, involving dozens of summary tables and basic plots. RTutor can automate a huge chunk of this. Asking it to "give me a full EDA report" can save you hours of boilerplate coding.
The fact that it doesn't just give you a black-box answer but shows you the code is a fantastic feature, especially for learning. If you're an R beginner, you can use it to see how a professional-looking chart is made. You can take that code, tweak it, and learn from it. It’s like having a tutor sitting over your shoulder, without the judgment when you forget a comma.
The interactive visualizations are also a solid plus. Since it’s built on Shiny, you often get charts and tables you can actually play with, which is way more insightful than a static JPG. It’s one thing to see a trend, it’s another to filter and drill down into it on the fly.
Let's Be Real: The Bumps in the Road
Okay, it's not a perfect unicorn. As with any AI tool, especially one that generates code, you have to keep your wits about you. The single biggest caveat is that the generated code can be logically wrong. It might run without an error, but the result could be misleading because the AI misinterpreted your request. I once asked it to compare two segments, and it produced a beautiful chart… that compared something completely different. It looked plausible, but it was incorrect. Always, always, always double-check the code and the logic. This is an assistant, not a replacement for your brain.
It also has its limitations. It relies on OpenAI's models, so it's subject to their quirks and occasional downtime. And as I mentioned, it works best with clean, structured data. If your dataset is a mess, RTutor isn't going to be your magical data janitor; you need to clean it up first.
Here’s a quick breakdown of my thoughts:
| The Pros | The Cons |
|---|---|
| Turns natural language into R code, massively lowering the barrier to entry. | Generated code isn't always logically correct. You MUST verify it. |
| Automates tedious EDA tasks and report generation. | Requires data to be in a clean, traditional format. No messy data allowed. |
| Great learning tool for R beginners to see how code is constructed. | Relies on OpenAI models, so it's not a fully independent system. |
| Provides interactive charts and outputs via Shiny. | Commercial use requires a license, so it's not entirely free for business. |
Who Is This Tool Actually For?
So who should be using RTutor? In my opinion, it hits a sweet spot for a few groups:
- Marketers and SEOs: We often have CSVs of campaign data, keyword rankings, or analytics exports. Being able to quickly ask, "show me the week-over-week growth for organic traffic" without opening a massive spreadsheet is a huge time-saver.
- Students and R Learners: It’s an incredible learning aid. Stuck on a problem? Ask RTutor and see how it would solve it. It's like having infinite, patient examples.
- 'Data-Curious' Professionals: People who aren't data scientists but need to get quick answers from data. Think product managers, business analysts, or founders who want to be more data-driven but don't have the time to become coding experts.
Who is it not for? Probably the hardcore, seasoned R programmer. If you're already fluent in Tidyverse and can write complex functions in your sleep, you might find it more restrictive than helpful. You're the one writing the code, not asking an AI to do it for you.
What About the Price Tag?
Here’s where things get a bit foggy. When I went looking for a dedicated pricing page... I found a 'Not Found' error. This happens. Maybe the page is being updated, maybe it's a custom-quote situation. The tool itself mentions that commercial use requires a license, which is an important flag. So, while you can likely play around with it for personal projects or learning, if you plan to use this for your business reports, you'll need to sort out the licensing. It’s a common model for tools built on open-source frameworks—free for personal use, paid for commercial.
Frequently Asked Questions about RTutor
1. Do I need to know any R to use RTutor?
Not really, no. You can get meaningful results just by asking questions in English. However, having a basic understanding of R will help you verify the code and understand exactly what the tool is doing, which I strongly recommend.
2. Is the code generated by RTutor always correct?
Absolutely not. This is probably the most important thing to remember. The code will usually run, but it might not be doing what you think it's doing. Always treat it as a talented but sometimes confused assistant. Check the work!
3. Can I use RTutor for my business?
Yes, but you'll likely need a commercial license. The platform is pretty clear about this. For any work-related analysis, you should assume it's a paid tool and reach out to them for details.
4. How is this different from just asking ChatGPT to write R code?
That's a great question. The key difference is that RTutor is an integrated environment. It doesn't just give you a block of text; it generates and executes the code right there, and then displays the output (the plot, the table) within the app. It closes the loop, saving you the step of copying, pasting, and running the code yourself.
5. What kind of data works best?
Think traditional, tabular data. CSV files or Excel sheets with clear columns and rows are ideal. It's not designed for unstructured data like raw text documents or image files.
My Final Verdict on RTutor
So, is RTutor the end of learning to code in R? No. Is it a useless gimmick? Definitely not.
I see it as a powerful force multiplier. It’s a tool that can democratize data analysis, making it more accessible to people who have the right questions but not the specific coding skills. For experts, it can be a real time-saver for knocking out the mundane, repetitive parts of data exploration. For beginners, it’s one of the best interactive learning tools I've seen.
The trick is to use it with your eyes open. Understand its strengths, be aware of its weaknesses (that's a biggy), and never, ever trust its output blindly. If you can do that, RTutor could be a fantastic addition to your analytics toolkit. It won't turn you into a goat farmer, and it might just save your laptop from an untimely demise.
Reference and Sources
- The RTutor application appears to be hosted on platforms like Shinyapps.io. A version of it can be explored, but a stable, official homepage was not readily available at the time of writing.
- The platform's interface also suggests trying a related tool: Chatlize.ai
- Information on R Shiny and OpenAI's models (like GPT-4o) provide context for the underlying technology.