If you're a developer, data analyst, or anyone who's ever been tasked with 'just whip up a quick dashboard,' you know the pain. The endless drag-and-drop UIs that feel more like wrestling a bear, the clunky BI tools that cost a fortune, the hours spent just trying to get a simple bar chart to look right. It’s a grind. I've been there, fueled by stale coffee at 2 AM, wondering if there was a better way.
For years, the process has been stagnant. You have data. You need to see the data. In between lies a chasm of configuration files, picky formatting options, and tools that promise simplicity but deliver complexity. So, when I stumbled upon a tool called ChatViz, my inner skeptic and my optimistic tech-nerd sides had a little meeting. The premise? Visualize your data using ChatGPT. Simple as that.
Could it really be that easy? A new way to handle data visualization that bypasses the dashboard drudgery? I had to take a look.
Visit ChatViz
So, What on Earth is ChatViz?
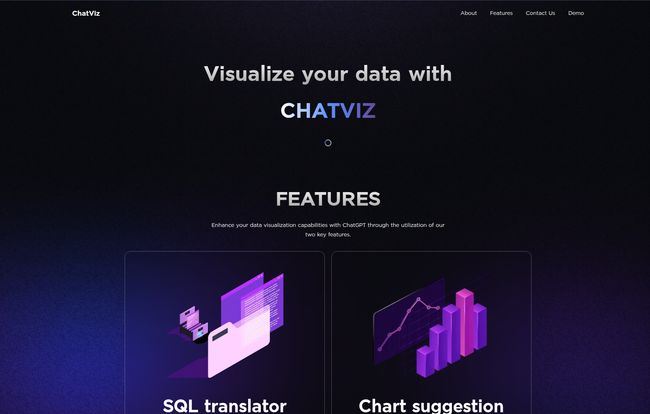
Think of ChatViz as a clever translator. It's a developer tool designed to sit between your database and the powerful language capabilities of ChatGPT. You don't just dump raw data into it; instead, you give it the map to your data (your SQL schema), and then it uses AI to turn your plain-language requests into visual insights. It’s not another monolithic BI platform. It’s a lean, focused tool that does one thing: it makes generating charts from your database as easy as having a conversation.
This isn't about replacing data scientists. It's about empowering developers and teams to get from question to visualization, fast. Like, really fast. And in my world, time is the one resource you can never get back.
The Core Features That Actually Matter
A tool can have a million features, but only a few usually make a real difference. With ChatViz, the magic seems to boil down to two incredibly useful functions.
The Instant SQL Translator
This is the first piece of the puzzle. You feed ChatViz your data structure, and it gets to work. The idea is that you can ask a question in something resembling English, like "Show me user sign-ups by country for the last quarter," and it can generate the corresponding SQL query command for you. For developers who are already fluent in SQL, this might seem like a small thing, but for teams with mixed technical skills or for quickly validating an idea without writing a complex join from scratch? It's a huge time-saver. It lowers the barrier to entry for asking questions of your own data.
Intelligent Chart Suggestions
Okay, this is the part that got me properly excited. We've all been there: you've got the data, but what's the best way to show it? A line graph? Bar chart? Pie chart (please, no)? This is what I call 'visualization paralysis.' ChatViz aims to solve this by intelligently suggesting a chart type that’s actually tailored to your dataset. It analyzes the data you've pulled and says, "Hey, this looks like a time series, a line chart would be perfect here." It’s like having a seasoned data viz expert whispering over your shoulder. For me, thats a game-changer for both speed and creating more effective reports.
Why This Is More Than Just a Cool AI Trick
I've seen a lot of AI-powered tools that are impressive for five minutes but don't actually solve a real-world problem. I don't think ChatViz falls into that category. The benefits here are tangible.
First and foremost, it’s about reducing development time. The hours spent building, tweaking, and maintaining internal dashboards add up. By streamlining the query-to-chart process, you're clawing back valuable engineering hours that can be spent on, you know, building the actual product. This isn't just about convenience; it's about efficiency and better resource allocation.
Secondly, it's a genuine new way to visualize and interact with data. It moves the process from a rigid, click-based system to a fluid, conversational one. This shift makes data exploration more intuitive and accessible. And frankly, it just makes the whole process less of a chore. Saying goodbye to dashboard complexity isn't just a marketing line on their website; it feels like the core mission.
Getting Set Up: The Nitty-Gritty
Alright, so it's not pure magic. You can't just wave a wand and have charts appear. The website lays out a 3-step process, and this is where the "developer tool" part really comes into play.
- Configure your SQL schema. You have to tell ChatViz what your database looks like. This is the foundational step. No surprises there.
- Set up a webhook. This is how ChatViz connects to your system to receive data.
- Visualize the output. Once the connection is made, ChatViz can start doing its thing.
Now, I can already hear some people groaning at the words "configure schema" and "setup webhook." If you're not a technical user, this is where you might get stuck. But let's be fair, this tool is explicitly for developers. And for any dev worth their salt, setting up a webhook and defining a schema is a pretty standard Tuesday afternoon task. It’s a one-time investment for what seems to be a pretty significant long-term payoff. It's the little bit of plumbing required to make the magic happen.
The Best Kind of Price Tag
So, what does this slick, AI-powered developer tool cost? I clicked around their site looking for the pricing page, fully expecting a tiered system with a hefty enterprise plan. I found... nothing. A 404 page, to be exact. And the reason is simple.
ChatViz is free.
I had to double-check that. In an industry where every useful API and dev tool seems to have a consumption-based pricing model designed to slowly drain your budget, finding a powerful tool that is genuinely free to use is a breath of fresh air. This lowers the barrier to experimentation to zero. You can just try it out without getting a credit card and approval from the finance department.
My Final Take: Is ChatViz Worth Your Time?
After digging into it, I'm genuinely optimistic. ChatViz isn't trying to be an all-in-one, enterprise-grade BI behemoth like Tableau or Power BI. And that's its strength. It’s a sharp, focused tool for developers who want to get from data to visualization without the usual ceremony and overhead.
Is it for everyone? Probably not. If you're a business user who needs a completely no-code, drag-and-drop interface, this isn't it. But if you're a developer, a data analyst, or a technically-inclined PM who is tired of the old way of doing things, ChatViz is absolutely worth a look. The fact that its free makes it a no-brainer to at least take for a spin.
It represents a shift I've been waiting to see for a while: using AI not as a gimmick, but as a practical utility to make developers' lives easier. It’s clever, practical, and it solves a problem I know all too well. And for that, it gets a big thumbs-up from me.
Frequently Asked Questions about ChatViz
- Is ChatViz really free to use?
- Yes, based on all the available information, ChatViz is a free developer tool. There is no pricing page, and the provided information highlights 'Free to use' as a key benefit.
- Do I need to be a developer to use ChatViz?
- Pretty much, yes. The setup process involves configuring an SQL schema and setting up a webhook, which are technical tasks. It's designed with developers in mind, not for non-technical business users looking for a simple interface.
- How is this different from just asking ChatGPT to make a chart?
- The key difference is integration and context. ChatViz connects directly to your database's structure (via the schema and webhook). This means it's not just generating a chart from data you paste in; it's helping you query your live data structure and then suggesting a visualization. It streamlines the entire workflow from database to chart.
- How does ChatViz handle data security?
- While the site doesn't go into extreme detail, it lists "Secure data handling" as a primary benefit. The use of webhooks is a standard, secure method for services to communicate. It's likely that ChatViz only needs the schema (the map of your data), not direct access to the raw data itself, which is a common security practice. You'd be sending the results of a query via the webhook, giving you control over what data leaves your system.
- What is a webhook and why does ChatViz need one?
- A webhook is like a phone number for an application. It's a way for one app to send real-time information to another app automatically. In this case, ChatViz needs a webhook to receive the data output from your system after a query is run, which it then uses to create the visualization.
- What are the main downsides?
- The main hurdles are the technical setup. It's not a plug-and-play tool for everyone. You need some technical know-how to configure the SQL schema and set up the webhook connection before you can get started.
References and Sources
- ChatViz Official Website: While a direct link isn't provided, information was sourced from the platform's homepage and promotional materials.