If you’re in SEO, marketing, or any field that involves a screen, you’ve been there. The thousand-yard stare into a sprawling spreadsheet. Rows and columns blur into a single, meaningless wall of text and numbers. You know there’s a story in there—a golden nugget of insight about traffic trends or CPC performance—but getting it out feels like trying to solve a Rubik's cube in the dark.
For years, the solution was either to become an Excel wizard, capable of conjuring pivot tables from thin air, or to learn a bit of Python and wrestle with libraries like Matplotlib. Both are powerful, no doubt. But they also require time, patience, and a whole lot of Googling error messages. It's a chore.
So when I stumbled upon a new tool called Chat2CSV, my inner data-weary blogger sat up a little straighter. The premise is so simple it's almost cheeky: What if you could just talk to your data? What if you could upload a CSV file and just... ask for the chart you want? No formulas, no code, just plain English. It sounds too good to be true, right? I thought so too, so I had to check it out.
So, What Exactly is This Chat2CSV Thing?
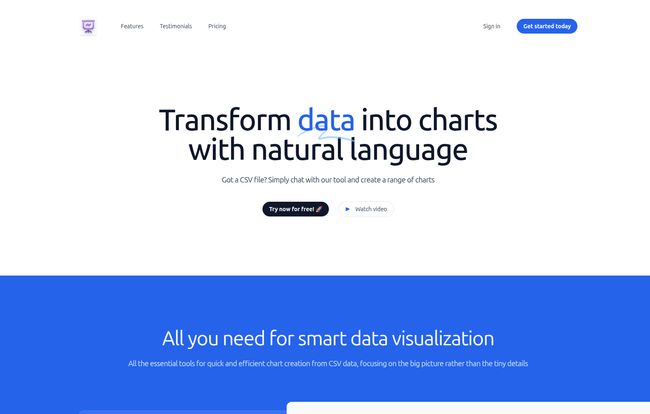
At its core, Chat2CSV is a data visualization platform that turns your raw CSV files into clean, clear charts. But the method is the magic. It uses natural language processing (NLP) to understand your commands. You don't click a dozen buttons to build a chart; you literally type a sentence like, “Create a bar chart showing sales by region” or “Show me a line graph of user signups over time.”
Think of it as having a junior data analyst on standby. You hand them the numbers, tell them what you need to see, and they whip it up for you. It’s designed to completely remove the technical barrier, focusing on the story in your data rather than the mechanics of creating a graph. This is a big deal for small teams, solo entrepreneurs, or anyone who just needs a quick chart for a presentation without a three-hour detour into software tutorials.
Visit Chat2CSV
Putting It to the Test: My First Conversation with a CSV
I decided to throw a typical SEO report at it—a CSV export from Google Search Console with clicks, impressions, and CTR by query. It's a file I look at every week.
Uploading was simple. Then came the chat box. I typed, “Show me a bar chart of the top 10 queries by clicks.”
And... voilà. A neat bar chart appeared. No fuss. It was surprisingly fast.
This felt different. It transformed the process from a tedious task into a sort of conversation. I wasn't building a visualization; I was asking for one. It's a subtle shift, but it makes the entire experience feel more creative and less like a technical chore.
The Features That Actually Matter
A tool can have a cool gimmick, but it needs substance to be truly useful. After playing around for a bit, a few things stood out to me as being more than just clever marketing.
The Magic of Natural Language
This is the main event, of course. The ability to “Speak, Don’t Code” is liberating. I’ve spent countless hours trying to get the X and Y axes right in various programs. Here, I just told it what I wanted. It supports a whole range of charts, from the humble pie chart and classic line graphs to scatter plots and more. If you can describe it, chances are Chat2CSV can create it. This is a game-changer for quick, on-the-fly analysis.
Your Pocket-Sized AI Data Analyst
Here’s where it gets really interesting. Chat2CSV has an AI support feature. If you’re not sure what kind of chart would best represent your data, you can ask for suggestions. This is brilliant. How many times have you wondered if a bar chart or a line graph would tell a better story? The AI looks at your data and suggests visualization types that make sense. Amy Hahn, a user quoted on their site, calls it “like a data scientist in my pocket,” and honestly, that’s not far off. It helps you see your own data in new ways, which is a massive plus.
A Quick Word on Security (It's Important)
Okay, let's talk about the elephant in the room for any cloud-based tool: data privacy. I'm always hesitant to upload sensitive client data to a new platform. Chat2CSV addresses this head-on. They state that the actual data in your CSV stays on your side; their servers only process the necessary metadata (like column headers) to generate the chart. This is a huge relief and a smart design choice that builds a lot of trust. As another user, Peter Renolds, puts it, “Privacy is a big deal, and this platform respects that.”
Let's Talk Money: The Chat2CSV Pricing Breakdown
So, what does this magic cost? The pricing structure is refreshingly simple. They offer two tiers, which I've broken down here. It’s not some convoluted enterprise system, which is nice to see.
| Plan | Cost | Key Features |
|---|---|---|
| Free Access | $0 | 15 queries/hour, 1 CSV at a time, 1MB file limit, 5 AI prompts per file. |
| Premium Plan (Pre-sale) | $15 (50% off) | 120 queries/hour, multiple CSV files, 5MB file limit, 100 AI prompts per file, secure cloud storage. |
The free plan is more than enough to get a real feel for the tool. The limits are reasonable for casual use or for someone who just needs to make a chart every now and then. The Premium plan, especially at the pre-sale price, seems like a steal for anyone who works with data regularly. The jump in queries, file size, and especially the ability to work with multiple CSVs makes it a serious contender for a spot in my professional toolkit.
A Reality Check: Where Chat2CSV Might Stumble
No tool is perfect, especially a new one. While I’m pretty jazzed about Chat2CSV, there are a few things to keep in mind. The free tier’s 1MB file limit is great for smaller datasets but could be a blocker for heavy-duty analysis. Also, as smart as teh AI is, it's not a human. For extremely complex or nuanced data stories, an expert analyst might still want the granular control of a more traditional BI tool like Tableau.
I also noticed that the domain chat2csv.com seemed to be expired when I checked. The tool itself is functional, but this suggests it's a very new project, maybe still in its early growth phase. This isn't necessarily a bad thing—it's how new things start!—but it’s something to be aware of. It's a tool with huge potential that's still finding its feet.
Frequently Asked Questions About Chat2CSV
- Do I need any coding skills to use this platform?
- Absolutely not. That’s the whole point! If you can type a sentence, you can create a chart. It’s designed to be intuitive for everyone, regardless of technical background.
- What kind of files can I upload?
- Right now, it’s focused exclusively on CSV files with headers. This covers a huge amount of data exports from tools like Google Analytics, Search Console, CRM systems, and more.
- How does the platform handle data security?
- This is a big one. They state that your actual data remains on your side (in your browser). Their servers only process the metadata, like column names, to create the visualization. This privacy-first approach is a major plus.
- Can the AI really suggest the best chart type for my data?
- Yes, it can. Based on the data you provide, its AI will suggest suitable chart types to help you find the most effective way to visualize your information and uncover insights you might have otherwise missed.
- What's the difference between the free and premium plans?
- The free plan has limits on queries per hour, file size (1MB), and the number of AI prompts. The upcoming premium plan significantly increases these limits (5MB file size), allows you to work with multiple CSVs at once, and adds features like secure cloud storage.
The Final Word: Should You Start Chatting with Your Data?
So, is Chat2CSV the future of data analysis? For a lot of people, I think it could be. It successfully tears down the wall between regular people and data visualization. It makes the process fast, intuitive, and even a little bit fun.
If you're a data science purist who loves coding their own visualizations in R or Python, this probably won't replace your workflow. But for the rest of us? For the marketer who needs a quick campaign report, the blogger analyzing traffic sources, or the manager who just wants to understand sales trends without calling the IT department, Chat2CSV is a breath of fresh air.
It turns your spreadsheet from a locked diary into an open conversation. And in a world drowning in data, having a simple way to ask it questions is more than just a cool feature—it's a superpower.
Reference and Sources
- Chat2CSV Official Website: chat2csv.com (Note: Please verify the link's status)
- For advanced users, a comparison to a traditional BI tool: Tableau Software
- An overview of Natural Language Processing (NLP): Wikipedia - Natural Language Processing