For years, I’ve had a love-hate relationship with visual content. I love what it does for my SEO—the backlinks from a killer infographic, the sky-high engagement on a well-designed social post. But I hate making it. As a words guy, staring at a blank design canvas gives me the same feeling as looking at a calculus equation. Utter confusion, followed by a strong desire to go do something else. Anything else.
I’ve tried everything. Fumbling through complex software that felt like it needed a pilot's license, hiring freelancers on Upwork with... mixed results, and even trying to pass off glorified spreadsheets as 'data visualization'. It wasn't pretty.
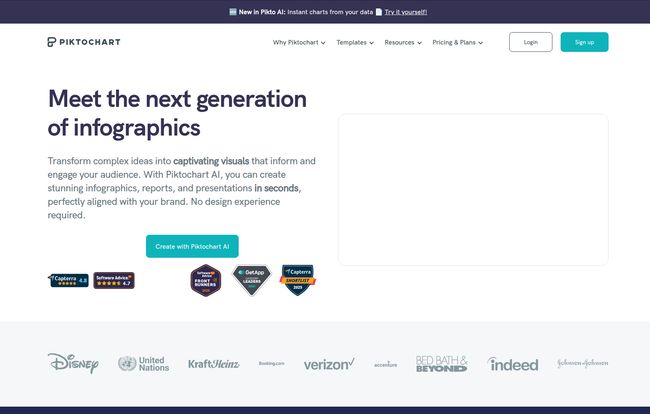
So when I started hearing the buzz about Piktochart and its AI-powered features, my ears perked up. Another design tool? Sure. But one that promises to do the heavy lifting for you? Now you have my attention. I decided to jump in, get my hands dirty, and see if it could really save content folks like me from design purgatory.
So, What Exactly Is Piktochart?
At first glance, you might lump Piktochart in with the dozens of other web-based design tools out there. But that's not the full story. It’s a visual communication tool, an AI-powered design assistant, a report builder. And honestly, it’s a bit of a lifesaver for those of us who weren't blessed with the 'graphic design gene'.
Piktochart’s bread and butter is turning data and information into beautiful, easy-to-digest visuals. We're talking about:
- Infographics: This is their home turf. They make creating long-form, data-rich infographics less of a chore.
- Reports: Think annual reports or client updates that people might actually read.
- Presentations: A solid alternative for when you want to break out of the standard PowerPoint mold.
- Social Media Graphics: All the usual suspects, from Instagram posts to LinkedIn banners.
The secret sauce here is the AI. It's not just about templates, it's about an 'AI Design Generator' that can whip up a professional-looking visual from a simple text prompt. The claim of creating “stunning infographics... in seconds” is a bold one, but it’s the direction they’re pushing. And seeing logos like Disney, Sony, and Verizon on their homepage tells me they're not just playing around.
Visit Piktochart
First Impressions: Getting My Hands Dirty
Signing up was simple enough, and I was dropped right into the dashboard. The interface is clean, I’ll give them that. It feels less cluttered than some competitors, which I appreciate. You’re greeted with options to create different types of visuals or, the shiny new toy, to try the AI design generator.
Of course, that’s where I went first.
That AI Design Generator Is a Real Game Changer
I decided to test it with a real-world task: creating an infographic about the 'Benefits of Content Marketing for Small Businesses'. I typed in the prompt, added a few key points I wanted to include, and hit go.
What it spat out a few seconds later was... impressive. Not perfect, mind you, but it was a fully-fledged, well-structured infographic. It had a title, sections with icons, and a coherent color scheme. It was about 80% of the way there. From there, I could just drag and drop elements, tweak the text, and swap out an icon or two. The whole process took me maybe 15 minutes, instead of the 2+ hours it would've taken from scratch. That's a huge win.
This is the magic. Starting with a blank canvas is like staring into the abyss. Piktochart's AI is like having a creative director whispering ideas in your ear, and its a welcome voice when you're on a deadline.
Who Is This Tool Really For?
After playing around for a while, it's clear Piktochart isn't trying to be a one-size-fits-all solution for every creative need. It has a definite focus. I see it being most valuable for:
Marketers, Bloggers, and SEOs
This is the sweet spot. If you need to create compelling visuals to support your articles, build backlinks with shareable infographics, or pump out weekly social media content, Piktochart is built for you. The ability to quickly visualize data from, say, a Google Analytics report or a market survey is incredibly powerful for content strategy.
Human Resources and Internal Communications
I've seen some truly terrible internal documents in my day. Piktochart is perfect for HR departments and managers who need to create engaging onboarding materials, professional-looking internal reports, or clear training presentations. It helps make company-wide information look polished and intentional, not like a last-minute Word doc.
Educators and Nonprofits
It’s cool that Piktochart offers specific, discounted plans for these groups. For a teacher trying to create engaging lesson materials or a nonprofit showcasing its impact to donors, this tool lowers the barrier to entry for creating high-quality visual aids. It’s a smart move on their part and genuinely helpful.
Let's Talk Money: The Piktochart Pricing Plans
Alright, let's get down to the brass tacks. Is it going to break the bank? Piktochart has a tiered structure that’s pretty standard for SaaS platforms. Here's my breakdown of the main plans.
| Plan | Price (Annual Billing) | Who It's For | Key Features |
|---|---|---|---|
| Free | $0 | Students, hobbyists, or those testing the waters. | Unlimited projects, all templates, 50 AI credits, but only 2 PNG downloads. |
| Pro | $14 /member/month | Freelancers, serious bloggers, and solo entrepreneurs. | Unlimited PNGs, 1000 AI credits, 5M+ premium assets, transparent backgrounds. |
| Business | $24 /member/month | Marketing teams and established businesses. | Everything in Pro, plus Brand Kit, unlimited PDF/PPT downloads, 3000 AI credits. |
In my book, the Pro plan hits the sweet spot for most serious content creators and small businesses. The jump from the Free plan is significant – unlimited high-res downloads and access to the full library of premium graphics is where the real power is. The Business plan is essential for teams who need to lock down their branding with the Brand Kit feature. No more guessing hex codes or using the wrong logo version. Finally.
The Not-So-Perfect Parts (My Honest Gripes)
No tool is perfect, and it wouldn't be an honest review if I didn't point out a few things that gave me pause.
First, the limitations on the Free plan are pretty tight. Only two PNG downloads is more of a trial than a truly functional free tier. You can create as much as you want, but you can't really do much with it. It forces an upgrade decision quickly, which I guess is the point.
Second, the AI credits system. While the Pro plan’s 1000 credits/month seems generous, every generation or significant AI-tweak uses them up. If you're heavily reliant on the AI generator for all your work, you might need to keep an eye on your usage.
Lastly, there is a bit of a learning curve to get the most out of it. Yes, it's easier than Adobe Illustrator—a lot easier. But to really master the data visualization tools and create truly custom designs, you'll need to spend a couple of hours poking around. It’s not instant magic, but it's close.
So, Is Piktochart Worth It? My Final Verdict
After spending a good amount of time with the platform, my answer is a resounding yes, for the right person.
If you're a designer who lives and breathes Adobe Creative Suite, this isn't for you. But if you're a marketer, business owner, educator, or just a 'non-designer' who desperately needs to create clean, professional-looking visuals without pulling your hair out, Piktochart is a fantastic ally.
It bridges the gap between overly simplistic, template-in-a-can apps and monstrously complex professional software. The AI generator is more than a gimmick; it’s a legitimate time-saver and a cure for creative block. It helps you get started, which is often the hardest part.
It won't design everything for you perfectly on the first try, but it gives you a massive head start. And in the world of content marketing, where speed and quality are always in a tug-of-war, a head start is often all you need.
Frequently Asked Questions About Piktochart
- Can I use Piktochart for free forever?
- Yes, there is a permanent Free plan. However, its features are limited, most notably allowing only two PNG file downloads ever. It's best for trying out the platform before committing to a paid plan.
- What's the main difference between Piktochart and Canva?
- While both are visual design tools, I've found that Piktochart has a stronger focus on data visualization—infographics, charts, and reports. Canva is more of an all-around design tool for a broader range of social and print media. If your work is data-heavy, Piktochart often has the edge.
- How do the AI credits work?
- You use AI credits each time you use the AI Design Generator to create a new visual. Paid plans come with a monthly allowance of credits (e.g., 1,000 for Pro). These credits reset each month.
- Can I upload my own fonts and logos?
- Yes, but this feature is part of the paid plans. The Business plan, in particular, has a 'Brand Kit' where you can upload your brand's specific colors, fonts, and logos to ensure consistency across all your designs.
- Is it easy to cancel a Piktochart subscription?
- Yes, based on their site and general user experience, you can manage your subscription and cancel it directly from your account settings without having to jump through hoops.