It’s 3:17 AM. Your phone buzzes with an anger that only PagerDuty can muster. It's another cryptic alert from the production Kubernetes cluster. CrashLoopBackOff. Is it a memory leak, a bad deployment, or did someone just look at the server rack funny? You roll out of bed, heart pounding, and prepare to dive into a rabbit hole of logs, metrics, and dashboards. Sound familiar? For anyone in DevOps or SRE, this isn't just a story; it's a Tuesday.
We've all been there, drowning in a sea of alerts, trying to connect the dots while the pressure mounts. This constant firefighting, this “alert fatigue,” is more than just an annoyance; it’s a productivity killer and a one-way ticket to burnout. So when a tool comes along promising to use GenAI to quiet the noise and even fix the problems automatically, my ears perk up. I’m talking about KubeHA. But is it just another tool adding to the complexity, or is it the Kubernetes co-pilot we've all been waiting for?
So What is KubeHA, Really?
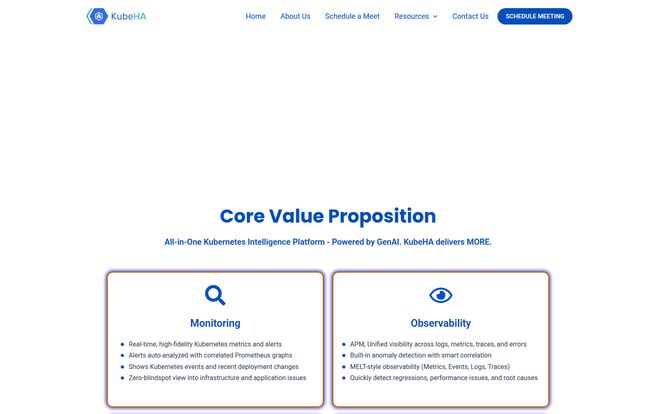
At its core, KubeHA pitches itself as an "All-in-one Kubernetes Intelligence Platform." That’s a mouthful, but the key word is Intelligence. It’s not just another dashboard showing you graphs. It aims to understand what’s happening in your cluster, connect the dots for you, and suggest—or even execute—the fix. Think of it less like a security camera and more like a security guard who actually knows what to do when the alarm goes off.
The company frames its value around the acronym MORE:
- Monitoring: It keeps an eye on your cluster's health, alerts, and deployment changes. Standard stuff, but necessary.
- Observability: This is where it gets interesting. It brings together logs, metrics, events, and traces to build a complete picture, so you’re not jumping between ten different tools.
- Remediation: The holy grail. It analyzes the problem and provides 1-click remediation suggestions. The goal is to go from alert to fix in minutes, not hours.
- Exploration: This is the cool, futuristic part. It integrates a KubeHA GPT, allowing you to ask questions about your cluster in plain English. No more wrestling with arcane `kubectl` commands to find what you need.
The Killer Features That Actually Matter
A feature list is just a list until you see how it solves a real problem. Let’s break down what KubeHA does into things that will actually change your workday.
From Alert Storm to Actionable Insight
The biggest headache with Kubernetes is the sheer volume of noise. A single underlying issue can trigger a cascade of alerts across different services. KubeHA’s AI engine is designed to cut through that. It automatically correlates alerts, events, and metrics, bundling dozens of notifications into a single, cohesive incident. Instead of getting 20 alerts, you get one that says, “Hey, the `auth-service` deployment is failing because of a new configuration change that’s causing a memory spike.” Now that’s something you can actually work with.
Visit KubeHA
The “Ask Me Anything” for Your Cluster
Let’s be honest, not everyone on the team is a Kubernetes guru. The “Exploration” feature, with its built-in GPT, is a genuine game-changer for debugging. Imagine being able to just ask, “What changed in the `ingress-controller` namespace in the last hour?” or “Show me the logs for the pods that are crashing.” This democratizes troubleshooting, making it accessible to more than just your senior SREs. It lowers the barrier to entry and speeds up diagnosis for everyone.
Runbooks on Autopilot
We all write runbooks. Those detailed, step-by-step guides on how to fix common problems. And mostly, they gather dust in a Confluence page until 3 AM, when you’re too tired to follow them properly. KubeHA aims to automate these. By analyzing an issue, it can match it to a known solution and suggest an automated remediation. That idea of resolving a recurring issue with a single click while you’re still sipping your morning coffee… that’s pretty compelling.
The Integration Dance: Plug-and-Play or a Chore?
Here’s something I found a bit confusing at first. The platform boasts about its “effortless integrations” and being “pre-integrated” with everything from Prometheus and Grafana to Slack and PagerDuty. The website says, “Just bring your applications - we'll handle the monitoring, observability, and remediation for you!”
However, one of the listed cons is that it “Requires integration with existing monitoring tools.” So, which is it? After digging in, it seems the answer is a bit of both. KubeHA is a SaaS platform that has the capability to connect to this whole ecosystem of tools out of the box. You don’t have to build the connectors yourself. But you do, of course, have to point it at your Prometheus instance, your Slack workspace, and your cluster. So it's not magic, but it does seem to handle the heavy lifting of wiring everything together, which is a significant time-saver in itself.
The Good, The Bad, and The AI Hallucinations
No tool is a silver bullet. I’m always skeptical of marketing claims, so it's important to look at both sides. Let's get real about the pros and cons.
The Good Stuff (The Real Wins)
The biggest win here isn’t teh technology; it’s the human impact. As one CEO from Kazoopps put it, KubeHA “saved us countless hours of manual toil and anxiety.” This is the whole point. It’s about reducing stress, eliminating context switching, and giving smart engineers their time back to build better products instead of just putting out fires. Scaling a team is hard, and scaling alert response is even harder. A tool that can absorb an increase in alert volume without requiring you to hire more on-call staff is a massive financial and operational win.
The Not-So-Shiny Bits (Let’s Be Honest)
On the flip side, there are a few things to keep in mind. First, AI hallucinations. It's a real thing. This is when the GenAI confidently suggests a fix that is completely wrong. KubeHA claims this is less frequent with their solution, but it’s a risk with any AI-driven tool. You can’t blindly trust it—at least not yet. Human oversight is still critical.
Second, there's a mentioned remediation latency of up to 2 minutes. For some critical systems, 120 seconds can feel like an eternity. But let’s put that in perspective. How long does it take for a human to get the alert, log in, diagnose, and act? Probably a lot more than two minutes. So, while not instantaneous, it’s likely a huge improvement for most scenarios.
So, How Much Does This Magic Cost?
This is the million-dollar question, isn't it? If you go looking for a pricing page on KubeHA’s website, you’ll hit a neat little “This page doesn’t seem to exist” message. Don't be alarmed; this is actually pretty standard for enterprise-grade B2B SaaS tools.
It means there's no one-size-fits-all price tag. The cost will almost certainly depend on factors like the size of your clusters, the number of nodes, the volume of data being ingested, and the level of support you need. The path forward is the big “Schedule a Demo” button. Be prepared to have a conversation with their sales team to get a custom quote tailored to your environment.
Who is KubeHA Actually For?
This tool isn’t for the hobbyist running a personal blog on a three-node k3s cluster. KubeHA is squarely aimed at organizations where Kubernetes has become a mission-critical, complex beast. If your company has a dedicated SRE or platform engineering team, if you’re struggling with on-call burnout, and if your Mean Time to Resolution (MTTR) is a KPI you’re constantly trying to improve, then you are the target audience. It’s for teams that have felt the pain of scale and are looking for a force multiplier.
Final Thoughts: Is KubeHA the Kubernetes Whisperer We Need?
Look, the complexity of cloud-native systems isn't going down. We need smarter tools, not just more dashboards. KubeHA is making a bold play to be that smart layer. It’s ambitious, combining observability, automated remediation, and a natural language interface in one package.
While the potential for AI mistakes is real and it requires careful implementation, the value proposition is incredibly strong. It’s focused on solving one of the most expensive and painful problems in modern IT operations: the human cost of complexity. For me, any platform that promises to turn a 3 AM fire drill into a 9 AM notification is worth a serious look. KubeHA appears to be a very serious contender in that fight.
Frequently Asked Questions (FAQ)
- 1. What is KubeHA in simple terms?
- KubeHA is a software platform that uses Generative AI to automatically analyze and help fix problems in Kubernetes environments. It's designed to reduce manual work for DevOps and SRE teams by making alert management smarter and faster.
- 2. How does KubeHA's GenAI help with alerts?
- Instead of just showing you an alert, its AI analyzes logs, metrics, and traces to find the root cause. It bundles related alerts into single incidents and can even suggest or automate the steps needed to fix the problem, based on runbooks and past events.
- 3. Does KubeHA replace tools like Prometheus or Datadog?
- Not exactly. KubeHA integrates with them. It acts as an intelligence layer on top of your existing monitoring and observability tools. It pulls data from sources like Prometheus, Datadog, and Loki to provide its analysis and remediation, so you don't have to rip and replace your current stack.
- 4. Is KubeHA secure to use in a production environment?
- Security is a primary concern. KubeHA mentions secure deployment options like its KubeHA SaaS-Pi (Platform-as-a-Service integrated), which suggests a focus on providing a secure, isolated environment for your data and operations. As with any tool, you should review their specific security practices during a demo.
- 5. How do I find out KubeHA's pricing?
- KubeHA does not have a public pricing page. This is common for enterprise tools. To get pricing information, you need to contact their sales team, typically by scheduling a demo through their website.
- 6. What's the biggest potential drawback of using KubeHA?
- The primary drawback is the inherent risk of any AI-powered system: hallucinations. The AI could potentially suggest an incorrect fix. Therefore, human oversight is still essential. There is also a potential remediation latency of up to two minutes to consider.
Reference and Sources
- KubeHA Official Website (Note: This is a presumed URL based on the branding)
- Google SRE Book: The Role of Automation