We've all been there. Staring at a blank PowerPoint slide, knowing you need to present some data, but the thought of wrestling with shapes and text boxes makes you want to throw your laptop out the window. For years, creating a decent-looking infographic meant either having a graphic design degree or begging that one friend who's a wizard with Adobe Illustrator. The rest of us were left with clunky, homemade visuals that screamed "I tried."But the game's changing. Fast. I've been in the SEO and traffic generation world long enough to see trends come and go, but the rise of accessible AI tools is something else entirely. It feels different. And that brings me to a new tool that landed on my radar: Infografix. It claims to be a free, AI-powered infographic generator. Free? AI? No design skills needed? That’s a bold trifecta. So, naturally, I had to see what the fuss was about.
So, What Exactly is Infografix?
In a nutshell, Infografix is a web and mobile app designed to help you create sharp-looking infographics without the usual headache. Think timelines, process maps, family trees, even SWOT analyses. The core idea is to take the design struggle out of the equation. You pick a template, let the AI give you a starting point for content, and then you just… edit. It’s built for the marketer on the go, the student with a deadline, or the small business owner who needs to make an impression but doesn't have a design budget.
It’s not trying to be Photoshop. And that's its biggest strength. It’s a specialized tool meant to do one thing really, really well: make data look good, quickly.
Why We Still Need to Care About Infographics
Okay, quick digression, but it's important. Why are we even talking about this? Because in the content world, visuals are king, queen, and the entire royal court. I’ve seen it time and time again with my clients. A well-designed infographic can get you more shares, more backlinks, and keep people on your page longer. It's about taking dense information and making it digestible, scannable, and frankly, more interesting.Our brains are wired for visuals. According to some research I stumbled upon a while back (I think it was from the Nielsen Norman Group, those UX nerds), people process images 60,000 times faster than text. Sixty. Thousand. So when you're fighting for attention online, showing your data is almost always better than just telling it.
Taking Infografix for a Spin: A Quick Walkthrough
Jumping into the tool feels pretty straightforward, which I appreciate. The interface is clean and not cluttered with a million buttons you'll never use. It seems to follow a simple, three-step logic: pick, generate, and customize.
Templates for Almost Everything
The first thing you notice is the variety of templates. It’s not just a one-size-fits-all deal. They’ve got options for:
- Timelines: Perfect for showing the history of a company or the steps in a project.
- Process Maps: To break down a complex workflow into easy-to-follow steps.
- Hierarchies: Think organizational charts or breaking down a broad topic.
- SWOT Analyses: A classic for business strategy, now you can make it look professional in minutes.
This is a solid foundation. You're not starting from a completely blank canvas, which is often the most intimidating part.
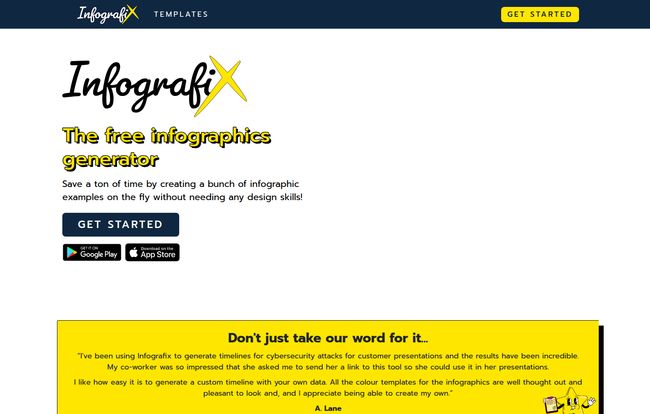
Visit Infografix
The AI Assistant: Your Creative Intern
Here’s where it gets interesting. Infografix has what it calls a "slice of AI to do the heavy lifting." Once you have a template, you can prompt the AI to generate the actual text and data for your infographic. For example, you could ask it for a timeline of "major software developments from 2011 to 2020," and it'll populate the template for you. This is a massive time-saver. It’s like having a research assistant who pulls the initial data, so you can focus on refining it.
But—and this is a big but—you absolutely must review what the AI gives you. AI is notorious for its little “hallucinations” or getting facts slightly wrong. Treat the AI-generated content as a first draft, not the final word. Always fact-check. It's an incredible starting point, not a replacement for your brain.
Making It Your Own
Once you have your structure and content, the customization begins. This is where I expected things to get complicated, but it's surprisingly simple. You can click on any element directly on the canvas and edit it. Change the text, swap out an icon, or adjust the layout. The color and font options are also pretty robust. You can select from pre-made palettes or, I assume, plug in your own brand colors to keep things consistent. It feels less like a complex design tool and more like an intuitive, drag-and-drop editor. From there, you can export your masterpiece as a PNG, JPG, SVG, or PDF, or even post it directly to your social channels. That last part is a nice touch for social media managers.
The Good, The Not-So-Bad, and The AI-Generated
So, what’s the verdict? No tool is perfect, right? After poking around, here's my take. The biggest advantage is obviously the cost, or lack thereof. It's free to use, which lowers the barrier to entry to basically zero. You don't need to be a designer, and the AI content generation, while needing supervision, is a fantastic feature for overcoming writer's block.
On the flip side, you’ll need an internet connection, which is standard for most SaaS tools these days. The bigger consideration is the reliance on the tool. As with any free platform, you have to wonder about the business model. Will there be a premium version later? Will features be locked behind a paywall? Right now it seems wide open, but that’s something to keep in mind. And I can't say it enough: you have to be the final editor on any AI-generated content. Don't just copy, paste, and post.
Who Is This Tool Really For?
I see a few groups getting a ton of value out of Infografix:
- Students: For making college assignments and presentations pop without spending hours in PowerPoint.
- Marketers & Social Media Managers: To quickly create engaging visual content for blog posts, social media feeds, and email newsletters.
- Small Business Owners: For creating internal documents, pitch decks, or marketing materials on a shoestring budget.
- Bloggers: To create custom graphics that improve on-page SEO and increase shareability.
If you're a professional graphic designer working at a major agency, this probably isn't going to replace your Adobe suite. But for the 99% of us who aren't, it’s a powerful and accessible alternative.
Let's Talk Price (Or Lack Thereof)
Everywhere on the site, it says "free." I clicked around looking for a pricing page, and... nothing. Just a 404 error. For now, it seems Infografix is genuinely free to get started with. This is awesome, but I always approach "free forever" promises with a healthy dose of skepticism. My guess is they might introduce a Pro plan down the line with more advanced features, higher export quality, or team collaboration. But for now, you can jump in and start creating without pulling out your credit card, which is a win in my book.
Frequently Asked Questions
Is Infografix really free to use?
As of right now, yes. The platform is advertised as free to use, and there is no pricing information available on their site. This could change in the future, but for now, you can use its features without a subscription.
Do I need to have design experience?
Not at all. The entire platform is built for non-designers. With a wide range of templates and an intuitive editor, you can create professional-looking infographics without any prior experience.
What is the AI content generation feature?
You can give the AI a topic or a prompt, and it will automatically generate text and data to fill your chosen infographic template. It's a great way to get a first draft done quickly, but you should always review and edit the content for accuracy.
Can I use Infografix on my phone?
Yes! They offer apps for both the Apple App Store and Google Play, so you can design infographics on your phone or tablet.
What file formats can I export my work in?
You can export your finished infographics in multiple formats, including PNG, JPG, SVG, and PDF, making them suitable for both web and print.
My Final Take on Infografix
So, is Infografix a revolutionary tool that will change the fabric of digital design? Probably not. Is it an incredibly useful, accessible, and smart tool that will save a ton of people a ton of time and frustration? Absolutely. It democratizes good design, putting powerful visual communication tools into the hands of anyone with an idea.
I’m impressed. For a free tool, the feature set is solid, the AI integration is clever, and the focus on user-friendliness is clear. If you've ever needed to make an infographic and didn't know where to start, give Infografix a shot. It might just become your new favorite secret weapon.
Reference and Sources
- Infografix Official Website: https://www.infografix.ai/
- Nielsen Norman Group (for general UX research): https://www.nngroup.com/
