For years, I've sat in marketing meetings where we obsess over every single metric. Click-through rates, bounce rates, conversion funnels... you name it, we track it. We A/B test button colors like our lives depend on it. Then, I'd walk over to the engineering side of the office (or, more recently, hop on a Zoom call) and ask the age-old question: "So, when's it gonna be ready?"
The answer was often a mix of educated guesswork, gut feelings, and a sprint board that looked more like a wish list than a timeline. And that’s not a knock on developers! It’s just that measuring engineering work is notoriously, frustratingly hard. Lines of code? A terrible metric. Story points? A necessary evil that's often gamed. It's been a black box.
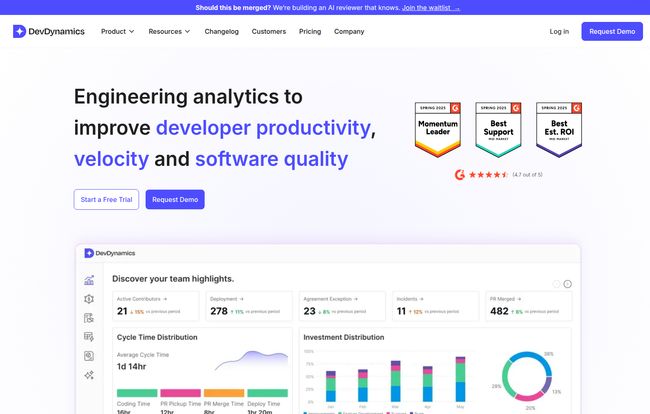
That's the problem platforms like DevDynamics are trying to solve. They call themselves an 'engineering analytics platform'. My immediate reaction is usually a healthy dose of skepticism. Great, another dashboard with more charts to ignore. But after spending some time looking at what they're doing, I gotta say, I'm intrigued. This might be different.
So, What is DevDynamics, Really?
Think of it like this: DevDynamics is like Google Analytics, but for your software development process. Instead of tracking website visitors, it hooks into the tools your team already uses—primarily your code repositories like GitHub and your project management tools like Jira—and starts to make sense of the chaos. It doesn't ask your team to change how they work or fill out more forms (thank god). It just watches the work as it happens.
The goal isn't to put a Big Brother-style spotlight on individual developers. I think that's a huge fear with tools like this. Instead, it acts more like a helpful flashlight, illuminating the dark corners of your workflow. Where are pull requests getting stuck? What's the actual, real-world cycle time from idea to deployment? Are we spending all our time on new features or just fighting fires? These are the questions engineering leaders lose sleep over, and DevDynamics promises to answer them with data, not feelings.
Why Most Engineering Metrics are a Nightmare (And How DevDynamics Tries to Fix It)
We've all heard of Goodhart's Law: "When a measure becomes a target, it ceases to be a good measure." This is the story of engineering metrics. Tell a team their performance is based on lines of code, and you'll get a lot of bloated, inefficient code. It’s a classic trap.
DevDynamics sidesteps this by focusing on what are widely considered the gold-standard metrics for high-performing teams: the DORA metrics. Developed by Google's DevOps Research and Assessment team, these four metrics give you a holistic view of your team's velocity and stability. It's not about how much code, but how effectively you're shipping it.
- Deployment Frequency: How often are you successfully releasing to production?
- Lead Time for Changes: How long does it take to get committed code into production?
- Change Failure Rate: What percentage of your deployments cause a failure?
- Time to Restore Service: How long does it take to recover from a failure?
By tracking these, you're not measuring busyness; you're measuring effectiveness. DevDynamics pulls this data automatically and presents it in a way that actually makes sense. You can finally see if that new testing process you implemented is actually reducing your failure rate or just slowing everyone down.
Visit DevDynamics
The Standout Features That Aren't Just Fluff
Okay, so it tracks DORA metrics. That's cool, but other tools do that. What else is in the box?
Reports for Every Role in the Room
This, for me, is a huge one. A VP of Engineering and a front-line Team Lead care about very different things. The VP needs a high-level overview of cost, risk, and strategic alignment. The Team Lead needs to know if a PR has been sitting un-reviewed for three days and is blocking the whole team. DevDynamics gets this, offering role-based reports. So the CTO can get their executive summary for the board meeting, while the dev team can get Slack alerts about PRs that need their attention. It's the same data, just sliced and presented for the right audience.
AI-Powered Insights (No, Really)
I know, I know. "AI" is the most overused buzzword of the decade. But here, it seems to have a practical aplication. Instead of just giving you a chart, the AI can generate a summary: "Deployment frequency is down 15% this sprint, largely due to a 30% increase in PR review time." That's not just data; it's an insight. It's the starting point for a conversation, not just a number on a screen. That's a huge time-saver.
Translating Tech Work into Business Language
Ever tried to explain to a CFO why you need to spend two months refactoring a legacy system instead of building that shiny new feature they want? It's tough. The Engineering Cost Insights and Time Investment Breakdown features are your secret weapon here. You can literally show a breakdown of how much engineering time (and therefore, salary cost) is going into 'New Work' vs. 'Maintenance' vs. 'Rework'. When you can say, "We're spending 40% of our budget just keeping the lights on because of tech debt," that's a conversation that finance understands.
Let's Talk Money: The DevDynamics Pricing Tiers
Alright, the all-important question. What's this going to cost? The pricing structure is actually pretty straightforward, which I appreciate. They break it down into a few tiers.
| Plan | Price | Best For |
|---|---|---|
| Free | $0 | Small teams (up to 9 contributors) or anyone who wants to test the waters. You get the basic DORA metrics and standard integrations. A no-brainer to try. |
| Pro | $15 /contributor/mo | Growing teams that are getting serious about process. This unlocks custom dashboards, more integrations, and support for up to 50 contributors. |
| Business | $30 /contributor/mo | Larger organizations that need it all: unlimited contributors, custom integrations (like GitHub Copilot), executive reporting, and dedicated support. |
My take? The pricing feels fair. The free plan is genuinely useful for a small startup or a single team wanting to dip their toes in. The per-contributor model can add up for larger organizations, but at that scale, the cost of inefficiency is probably way higher than the cost of the tool.
The Good, The Bad, and The Realistic
No tool is perfect. Let's break it down.
The Good stuff is obvious: Finally getting real visibility into your engineering process. The focus on high-quality metrics like DORA. The role-based reports are brilliant. And it's SOC 2 certified, which is a huge green flag for any company that handles sensitive data. The 24/7 support is also a nice touch.
The not-so-good? Pricing can definitely be a factor for larger teams on a tight budget. And while they say setup is easy, integrating any new tool into a complex tech stack takes time and effort. Don't expect to just flip a switch and have perfect data in five minutes. And, naturally, some of the most powerful features, like the fully customizable metrics, are reserved for the priciest plans.
Ultimately, whether it's right for you is a question of maturity. If your team is still struggling with basic version control, a tool like this is probably overkill. But if you're a scaling company that feels like you're flying blind, this could be the instrumentation your cockpit has been missing.
Frequently Asked Questions about DevDynamics
Is DevDynamics just a tool for managers to spy on developers?
Absolutely not, and this is a critical point. The platform is designed to measure team and process health, not individual performance. It highlights bottlenecks like slow PR reviews or high failure rates, which are almost always system problems, not people problems. Used correctly, it helps teams, it doesn't police them.
How difficult is the setup process?
It's designed to be fairly simple. You primarily need to provide access to your Git provider (like GitHub, GitLab) and project management tool (like Jira). For most teams, this can be done in under an hour. More complex integrations will naturally take more time, but the core functionality is quick to get going.
Can I measure custom things specific to my team?
Yes, but this is a feature of the paid plans (Pro and Business). You can create custom dashboards and, on the Business plan, even configure fully custom metrics that matter to your specific workflow or business goals.
Is the Free plan actually useful or just a teaser?
It's surprisingly useful! For a team of up to 9 people, you get access to the core engineering metrics like Cycle Time and the DORA set. It's more than enough to get a real feel for the platform and start identifying areas for improvement. It's one of the better free tiers I've seen.
My Final Thoughts
Look, no software is a silver bullet. DevDynamics isn't going to magically fix your culture or solve all your problems. What it will do is give you a common language, based on objective data, to talk about those problems. It replaces "I feel like we're slowing down" with "Our cycle time has increased by 20% this quarter." That's a fundamentally different, and better, conversation to have.
In a world where every department is expected to be data-driven, engineering has been the last frontier. It feels like we're finally getting the tools to bring that same level of analytical rigor to the art of building software. And from what I've seen, DevDynamics is a pretty darn solid place to start.
Reference and Sources
- DevDynamics Official Website
- DevDynamics Pricing Page
- Goodhart's Law - Wikipedia
- Google Cloud DORA Report Information