We’ve all been there. It’s 10 PM, your eyes are burning from the blue light of your monitor, and you’re staring at a spreadsheet with 10,000 rows. You need to pull a simple trend for a presentation tomorrow morning, but the data is a mess. There are typos, empty cells, and the formatting looks like it was done by a chimpanzee on a sugar rush. You whisper to yourself, "There has to be a better way."
I've lived that life for years. As an SEO guy, I live and breathe data. Clicks, impressions, conversion rates, you name it. And for the longest time, my trusty—and often infuriating—spreadsheet was my main weapon. The VLOOKUPs, the pivot tables, the conditional formatting... it's a grind. A necessary one, but a grind nonetheless.
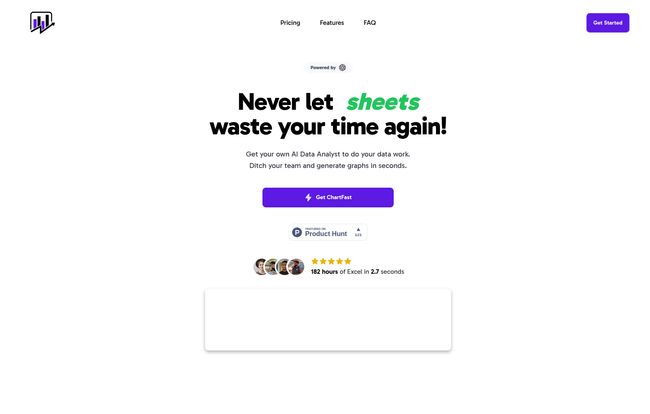
Lately, though, the AI wave has been bringing some seriously cool tools to shore. I've been experimenting with a bunch of them, but one that recently caught my eye is called ChartFast. The name is on the nose, I'll give it that. It promises to be an AI data analyst that turns your messy data into clean graphs in seconds. A bold claim. So, naturally, I had to see if it was just marketing fluff or the real deal.
So What Exactly Is ChartFast?
Think of ChartFast as a translator. Your spreadsheet speaks a clunky, complicated language of cells and formulas. You speak the language of human questions, like "What were our sales trends in Q3?" or "Show me the top-performing keywords." ChartFast, powered by OpenAI's shiny new GPT-4o model, acts as the interpreter between you and your data. You upload a file (like a CSV), ask a question in plain English, and it spits out a visualization. No formulas, no pivot table drama, just answers.
It’s designed to automate all the tedious, repetitive stuff that, according to their own site, causes 80% of projects to run late. And honestly? I believe that statistic. The amount of time I've sunk into just cleaning data before I can even start analyzing it is... well, let's not talk about it. It’s depressing.
<
>
Putting ChartFast to the Test: My Real-World Experience
Okay, enough theory. I took a gnarly keyword research export—a few thousand rows of keywords, search volume, CPC, and ranking difficulty—and threw it at ChartFast to see what would happen. Here’s how it went down with its main features.
Instant Gratification with AI Graphing
This is the headline act, the main event. I uploaded my CSV and simply typed, "Plot a bar chart of the top 10 keywords by search volume." Seconds later, a clean, professional-looking bar chart appeared. No messing with chart settings, no selecting data ranges. It just... worked. It was one of those moments where you kind of chuckle and think,
Well, there go a few hours of my life I'm never getting back.
It felt like having a data sous-chef who does all the chopping and prep work, so you can just get to the fun part of cooking.
Letting the AI Get Its Hands Dirty with Data Cleaning
This is where things got really interesting for me. My export had some blank rows and a few #N/A errors. Usually, that means a tedious session of find-and-replace or filtering. ChartFast seems to handle a lot of this automatically. It pre-processes the data on request, smoothing out the rough edges so the visualizations are accurate. It's not a magic wand that can fix fundamentally broken data, but for the common little errors that plague every dataset? It’s a massive timesaver.
<
Visit ChartFast
>
Actually Talking to Your Data
The feature they call "Interactive Data Queries" is probably the most powerful. This is the part where you have a conversation. I started asking follow-up questions. "Of those top 10, which have a CPC under $2?" A new, filtered chart popped up. "Now show this as a scatter plot comparing CPC and search volume." Done. This back-and-forth feels so much more intuitive than building a new pivot table for every single question. It's less about being a spreadsheet guru and more about being a curious human.
The Good, The Bad, and The Data
No tool is perfect, right? After playing around with it for a while, I've got a pretty clear picture of where ChartFast shines and where it stumbles a bit.
What I Genuinely Liked
The speed is the most obvious win. Tasks that would take me 15-30 minutes of focused, curse-filled clicking in Excel are done in under 30 seconds. This isn't a small improvement; it's a fundamental change in workflow. The accuracy is another big one. By letting the AI handle the grunt work, you reduce the chance of human error. I've made plenty of mistakes in my time by selecting the wrong column or messing up a formula, and this tool pretty much eliminates that risk. And finally, the accessibility. You dont have to be a data wizard to get valuable insights from your numbers anymore.
A Few Caveats to Consider
Now for the other side of the coin. The Starter plan, while cheap, is pretty limited. 250 "generations" (a chart, an answer, etc.) might sound like a lot, but if you're doing heavy analysis, you could burn through that. The 5-file upload limit at a time is also a bit restrictive for bigger projects. To really get the most out of it, you almost certainly need the Advanced plan. My biggest personal gripe, and this is an important one, is their refund policy. They only offer refunds in the form of credit, not cash back. So if you buy it and decide it's not for you, you're getting credit for another purchase, not your money back. Just something to be aware of before you click 'buy'.
<
>
Let's Talk Money: The ChartFast Pricing Breakdown
This is where ChartFast gets really compelling, especially for freelancers or small teams. They're currently running what looks like a lifetime deal (LTD). You pay once, and you get access forever. This is a refreshing change from teh endless sea of $20/month subscriptions.
| Plan | Price (One-Time) | Key Features |
|---|---|---|
| Starter | $9 | 250 generations/month, 5 file upload limit, Lifetime Dashboard Access |
| Advanced | $15 | 1000 generations/month, Unlimited file uploads, Better for large data, Priority support |
In my opinion, the Starter plan at $9 is a complete impulse buy. It's less than two fancy coffees. It's perfect for students, or for professionals who only need to make a few quick charts a month. However, for anyone who works with data regularly—marketers, analysts, business owners—the Advanced plan for a one-time fee of $15 is an absolute no-brainer. The value is just insane. Unlimited uploads and 1000 generations a month for a one-off payment is a deal you rarely see anymore.
Is This Just for Hardcore Data Scientists?
Absolutely not. In fact, I'd argue the opposite. A hardcore data scientist is probably already comfortable coding in Python or R and using libraries like Matplotlib or ggplot2. They might find this tool a bit basic for their most complex needs.
This tool is for the rest of us. It's for the marketing manager who needs to show campaign ROI. It's for the small business owner trying to understand sales data. It's for the blogger analyzing traffic sources. The testimonials on their site back this up, with people from various backgrounds praising its simplicity. As one founder, Hiromu Masuda, put it:
"This tool has completely changed how I work with data. Creating charts and analyzing data is so much faster now. It's been a real lifesaver!"
That says it all, really. It's about democratizing data analysis.
<
>
The Verdict: Should You Ditch Your Spreadsheets?
So, is it time to drag your Excel or Google Sheets icon to the trash? No, not entirely. Spreadsheets are still powerful databases and calculators. But for the task of analysis and visualization, ChartFast presents a compelling, faster, and frankly more enjoyable alternative. It’s not a replacement; it’s an augmentation. A specialized tool that does one thing incredibly well.
For a one-time cost that’s less than a month of many other software tools, you're buying back hours of your time. You're outsourcing the most boring part of your job to an AI that doesn't get tired or make silly mistakes. For me, that's an easy decision. Spreadsheets may be 20th-century relics for this kind of work, and it's about time we moved on.
Frequently Asked Questions
How does ChartFast actually work?
It uses a powerful AI model (GPT-4o) to understand your text commands. When you upload a data file and ask a question, the AI analyzes your request, processes the data accordingly, and uses internal graphing libraries to generate the visualization you asked for. It's all done in the cloud in a matter of seconds.
Is ChartFast good for very large datasets?
The Advanced plan is specifically designed for this. It runs in a high-RAM environment, making it more capable of handling larger files without slowing down. For massive, multi-gigabyte files, you might still need more specialized desktop software, but for typical business spreadsheets (up to hundreds of thousands of rows), the Advanced plan should be quite capable.
What happens if I want a refund?
This is a key point: ChartFast’s policy states that refunds are issued as credit for their service, not as a cash refund to your original payment method. It's important to be sure about your purchase before you commit.
Can I customize the charts and graphs?
Yes, the platform offers customizable visualization code. This allows users with a bit more technical know-how to tweak the appearance and details of their graphs beyond the standard output, giving you more control over the final look for presentations and reports.
Is the pricing really a one-time payment?
Based on their current offering, yes. The site promotes a lifetime deal where you pay once for either the Starter or Advanced plan and get ongoing access and monthly generation credits without a recurring subscription fee. This could change in the future, but as of now, it's a one-and-done deal.
Is my data secure with ChartFast?
This is a valid concern with any cloud-based tool. While their privacy policy would have the full details, generally, services like this process your data for the purpose of fulfilling your request and typically have security measures in place. However, it's always a good practice to anonymize any highly sensitive or personally identifiable information (PII) before uploading it to any third-party service.
Final Thoughts
Look, the world is moving fast. The tools we used five years ago are quickly being replaced by smarter, AI-driven alternatives. ChartFast is a prime example of this shift in the data analysis space. It’s simple, powerful, and priced so aggressively (for now) that it’s almost hard to ignore. It takes the pain out of data visualization and lets you get back to what's really important: understanding the story your data is trying to tell.